.svg)
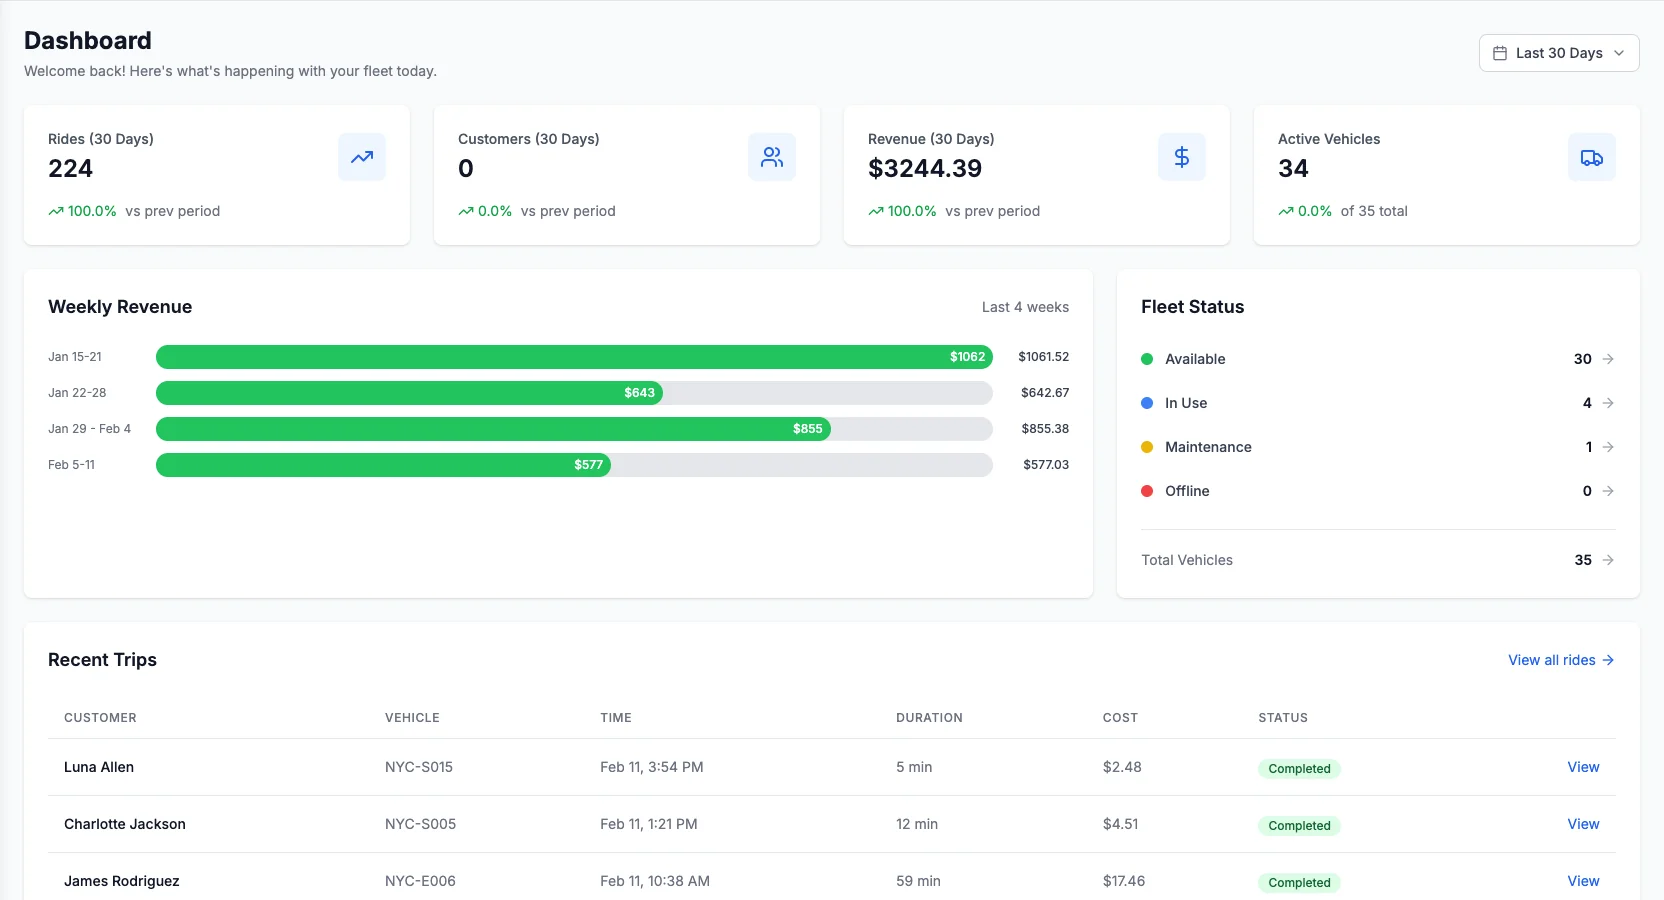
Most operators track dozens of numbers. Only four decide whether the business works: utilization, rides per vehicle per day, revenue per vehicle per day, and breakeven. If these four are healthy, the rest tend to follow. If they are not, no amount of dashboards will save you. This lesson defines each one precisely, tells you which vehicle count to divide by, separates gross revenue from net and contribution from profit, and gives you a concrete action threshold for each metric. The same four numbers drive the projection in the Fleet Estimator, so learn to read them before you buy a single vehicle.
Operator education, not financial advice
The numbers, ranges, and cost stacks in this lesson are illustrative planning inputs, not guarantees or professional advice. Fleet economics vary by market, season, vehicle mix, and how hard you run the operation. Before you commit capital, model your own figures in the Fleet Estimator and confirm the tax, accounting, insurance, and legal treatment with a licensed professional.
Get your denominators straight
Every KPI here is a ratio, and the answer changes depending on which vehicle count you divide by. Three counts matter, and operators mix them up constantly:
- Active vehicles. Vehicles connected to the platform and part of your commercial fleet. This is the count your Levy plan keys off (for example, the Managed plan is 20 percent of GMV under 100 active vehicles and drops to 15 percent at 100 to 249 active vehicles on an annual or approved term). It includes vehicles temporarily off the street for repair, so it is the broadest count and your billing and capital base.
- Deployed vehicles. The subset actually out on the street and rentable right now. A vehicle in your warehouse, in a repair queue, or dead on a charger is active but not deployed.
- Available vehicles. The subset of deployed vehicles that are ready to unlock this minute: charged, healthy, and inside a service zone. Availability is deployment minus the vehicles that are technically on the street but cannot take a ride (low battery, flagged fault, out of zone).
Which one you use is not a detail, it changes the story. Divide rides by available vehicles and utilization looks great while idle capital sits in a warehouse. Divide by active vehicles and you fold your entire idle fleet into the denominator, which is honest but can look alarming during a repair backlog. The working rule: for the earning metrics (rides and revenue per vehicle per day) divide by deployed vehicles, because a vehicle you paid for and put on the street should be earning. Track availability separately as an uptime metric, and track active as your billing and capital base.
Utilization
Utilization is the share of your deployed fleet that is actually earning. A vehicle that is dead on a charger, waiting on a repair, or sitting in a low-demand spot is not utilized, even though you paid for it.
There are two ways operators talk about it:
- Rides-based: the share of deployed vehicles that get at least one ride on a given day. Simple, and the fastest read on whether vehicles are in the right place.
- Time-based: the share of available hours a vehicle spends actually rented. More precise, harder to compute, and better for catching vehicles that ride once and then sit.
Utilization is the single biggest lever on your margin. A fleet at 15 percent utilization and a fleet at 45 percent utilization can own identical hardware and land in completely different places, one losing money and one comfortably profitable. Everything else on this list is downstream of it.
Action threshold. When a block of vehicles gets zero rides day after day (rides-based utilization stuck low in a given zone), the fix is placement or fleet size, not more hardware. Pull the dead-zone vehicles and restage them where demand is, or shrink deployment until the vehicles you do run are earning. Adding vehicles to a low-utilization fleet just multiplies idle capital.
Rides per vehicle per day
Rides per vehicle per day (often written RVD) is the workhorse metric. Take total daily rides and divide by the number of vehicles deployed. It is easy to measure, it is hard to fake, and it maps directly to revenue.
A healthy urban scooter fleet often targets an industry planning range of about 3 to 5 rides per vehicle per day. Treat that as a starting assumption, not a promise: campus fleets spike around class schedules and empty out on breaks, tourist markets swing hard with the season, and low-density suburban deployments run lower and lean on longer average trips to compensate. Your numbers will differ, so model them in the Fleet Estimator rather than adopting a universal benchmark.
Watch the trend more than any single day. RVD climbing week over week as you tune vehicle placement and pricing is the clearest sign your operation is finding its market. A flat or falling RVD while you add vehicles is a warning that you are scaling before the city has found its demand.
Action threshold. Hold RVD against your breakeven RVD, the rides each vehicle needs just to cover its daily cost (defined below). Any vehicle running below its breakeven RVD loses money every day it stays deployed. That is your trigger to rebalance it, repair it, or pull it, not to wait and hope it recovers on its own.
Revenue per vehicle per day
Revenue per vehicle per day (RPVD) is where rides turn into dollars. Multiply rides per vehicle per day by your average revenue per ride (unlock fee plus per-minute charges, net of discounts). It compresses utilization, ride volume, and pricing into one number you can hold against cost. The distinction that trips up most first-year operators is gross versus net.
Gross vs net RPVD
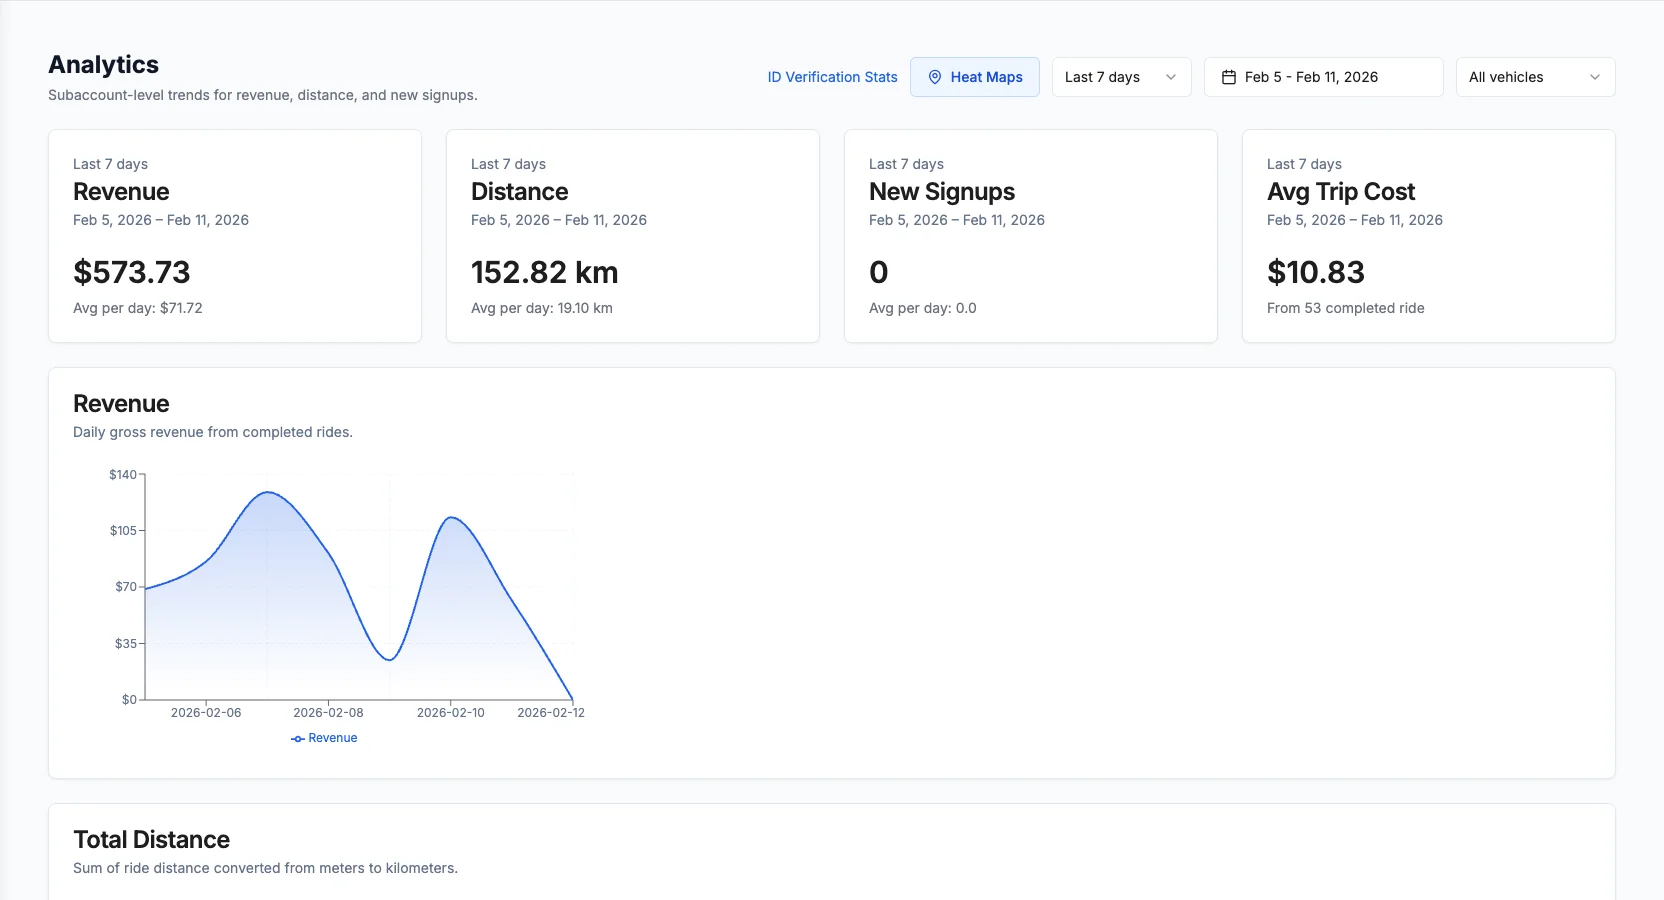
Gross RPVD is total daily rider payments divided by vehicles deployed. This is your GMV per vehicle, where GMV is gross rider payments before taxes, government fees, refunds, and tips. Use it as your clean operating metric because it is comparable across days and markets.
Net RPVD is what actually reaches your bank account, after two layers you should keep separate rather than blending into one number:
- Your platform fee. On the Managed plan, Levy's fee is 20 percent of GMV under 100 active vehicles, dropping to 15 percent of GMV at 100 to 249 active vehicles on an annual or approved term. Your partner payout is calculated on net revenue after Stripe processing, shared proportionally, and defaults to 80 percent of that net (85 percent at the 15 percent tier), so plan on roughly 80 percent of net rather than 80 percent of gross, and confirm the exact split in your agreement. On Software-Only (100 to 249 vehicles, in-house operations, annual commitment) you pay a flat $14 per vehicle per month instead of a percentage. There is $0 upfront on either plan and you pay when riders pay, but note the floor: a $250 per month platform minimum per operator, credited against your fees, so your platform cost is never truly zero.
- Payment processing. Levy's volume pricing is 2.6 percent plus $0.20 per transaction (versus a standard 2.9 percent plus $0.30). Operator and Levy share those processing costs proportionally.
If you subtract both layers from gross to land on a net figure, treat that as a conservative estimate, not an exact payout: the real split depends on your transaction sizes, refund rate, and whether the $250 minimum bites in a slow month. The Fleet Estimator runs this math for your own inputs.
Contribution vs profit
Once you have net RPVD, subtract the vehicle's own daily costs to get its vehicle-level contribution. That daily cost stack usually includes:
- Hardware amortization (the vehicle spread over its useful life)
- Charging or battery swapping
- Maintenance and repairs
- Connectivity (the IoT SIM)
- Field labor for rebalancing and cleaning
Net RPVD minus that stack is contribution per vehicle per day. Contribution is not profit. It is the money each vehicle throws off before your business-level overhead, and calling it profit is how operators talk themselves into fleets that lose money at scale. To reach actual profit, subtract the costs that do not live on any single vehicle: insurance, city permits and fees, storage and warehousing, marketing and rider acquisition, taxes, a theft and loss reserve, and your own overhead. A fleet can show healthy per-vehicle contribution and still lose money once those land, which is exactly why you keep the two labels apart.
Action threshold. When net RPVD sits comfortably above your loaded daily cost per vehicle, each vehicle contributes margin and scaling is the right move. When net RPVD hovers at or below it, adding vehicles just multiplies the loss, and the fix is placement, pricing, or uptime, not more hardware. Confirm positive contribution first, then confirm the whole fleet still clears overhead before you call any of it profit.
Breakeven
Breakeven is the point where a vehicle covers its own cost: the ride count at which net RPVD equals the vehicle's loaded daily cost. Below it the vehicle bleeds, above it the vehicle contributes.
The practical form is breakeven RVD, how many rides per day each vehicle needs to get there. If your loaded daily cost per vehicle is a few dollars and your average net revenue per ride is a couple of dollars, your breakeven might be as low as one to two rides per vehicle per day. Higher-value vehicles (e-bikes, mopeds) earn more per ride but carry a higher daily cost, so a bigger fare does not automatically buy a lower breakeven. Model each vehicle type separately, and treat these figures as planning ranges to test against your own costs in the Fleet Estimator, not fixed benchmarks.
Knowing your breakeven RVD changes how you make decisions: you can look at a new deployment zone, a price change, or a new vehicle model and tell at a glance whether it moves you toward breakeven or away from it, before you commit.
Action threshold. Set breakeven RVD as a hard line on your dashboard. Any zone or vehicle model that cannot clear it within a reasonable ramp (a few weeks of tuning placement and pricing) is a candidate to cut, not to subsidize indefinitely. Breakeven is a floor, not a target: you want RVD comfortably above it so a bad-weather week does not push the fleet underwater.
The four KPIs at a glance
Keep the denominator, the healthy signal, and the downside trigger for each metric in one place. The trigger column is the part most operators skip, and it is the part that saves money.
| KPI | Divide by | Healthy signal | Downside trigger and action |
|---|---|---|---|
| Utilization | Deployed vehicles | Rising share of vehicles earning daily | Vehicles idle in a zone: restage or shrink deployment |
| Rides per vehicle per day | Deployed vehicles | RVD trending up week over week | RVD below breakeven RVD: rebalance, repair, or pull |
| Revenue per vehicle per day | Deployed vehicles (gross), then net of fees | Net RPVD comfortably above daily cost | Net RPVD at or below daily cost: fix placement, pricing, or uptime, stop adding vehicles |
| Breakeven | A threshold, not a ratio | RVD sits well above breakeven RVD | RVD at or below breakeven: cut the zone or model that cannot ramp |
Put the numbers to work
These four metrics form a chain. Utilization drives rides per vehicle per day, which drives revenue per vehicle per day, which you measure against breakeven. Improve the top of the chain and everything below it moves. Read them on deployed vehicles, separate gross from net, and never call contribution profit until overhead is covered.
The fastest way to see how the chain behaves for your market is to model it. Plug your city, fleet size, and pricing into the Fleet Estimator to get projected utilization, revenue, and breakeven, then read the full profitability breakdown for the assumptions behind those projections. Your numbers will differ from any range on this page, so model them, get comfortable with these four before you spend a dollar on hardware, and you will make every later decision with your eyes open.
Model these four for your market
The ranges on this page are industry planning assumptions, not your results. Run your city and fleet plan through the Fleet Estimator to see projected utilization, rides and revenue per vehicle per day, and breakeven built around your own inputs.