.svg)
Your first market is the single highest-leverage decision you make as an operator, and it is the one most people rush. Pick a dense, permit-friendly city with real trip generators and you can hit healthy rides per vehicle per day in your first season. Pick a spread-out suburb with a hostile permit process and no natural demand, and no amount of marketing, pricing, or hardware will save the unit economics. The good news: market selection is not a gut call. It is a scorecard you can run on ten candidate cities in an afternoon. This lesson gives you that scorecard, a concrete weighting framework, and a worked example.
Levy Fleets is built for operators launching and scaling connected fleets, and the commercial model makes a first market low-risk: $0 upfront, revenue share, you pay when riders pay. Keep one fixed cost in view, though: there is a $250 per month platform minimum credited against fees, so a market has to clear that floor even in a slow month. Your job is not to find a perfect market, it is to find one where the demand math clears the cost math, then let the platform carry the operational load.
Planning guidance, not professional advice
This lesson is a planning framework, not legal, tax, insurance, or financial advice. Permit rules, device caps, per-vehicle fees, and market conditions vary by city and change often, and the figures here (including the $250 per month platform minimum) can change. Verify current local regulations with the city or a qualified attorney, and model your own numbers in the Fleet Estimator before you commit capital.
Why your first market decides everything
Two operators with identical vehicles, apps, and pricing can land in completely different places purely because one chose a market where people already want short trips and the other did not. Three things compound off the market choice:
- Demand ceiling. The trips a city can generate per day are capped by its density, visitors, and trip generators. You cannot market past that ceiling, only capture more or less of it.
- Cost floor. Terrain, sprawl, and weather set your per-vehicle spend on charging, rebalancing, and maintenance. A hilly, spread-out market costs more to service per ride than a flat, compact one.
- Regulatory risk. A market can look perfect and still be closed to you, or open today and capped or revoked in six months. Regulation is the factor that can zero out everything else.
Because these compound, weight the factors that can kill a market more heavily than the ones that merely shade the margin. That is what the framework below does.
The seven-factor market scorecard
Score each candidate market from 1 to 5 on all seven factors, where 1 is a serious problem and 5 is a genuine advantage. Do not skip a factor because it is hard to measure: a rough, honest 1 to 5 beats a precise number you never gathered.
1. Regulatory friendliness (weight 25)
This is the heaviest factor because it is the only one that can send your score to zero regardless of everything else. Before you fall in love with a city, answer: does it require a shared-mobility permit, is the window open, is there a device cap, is there a per-vehicle fee, and are operators being turned away or pushed out?
A 5 is a city with a clear, open permit process, a reasonable cap, and no history of yanking operators. A 1 has a moratorium, a closed window, or a track record of revoking permits. Smaller towns, campuses, resorts, and private properties often sit at a 4 or 5 because they are permissive or privately controlled, which is why first-time operators start there rather than in a contested major metro.
Levy's city compliance tooling is built for the regulated case: MDS 2.0 provider feeds, GBFS 3.0 feeds, city policy ingestion, real-time geofence enforcement, and a city portal with magic-link access. If your target city runs a formal program, handing over the feeds and enforcement they expect is part of what keeps a permit and wins the next one. Score the city on how heavy that lift is and how likely you are to clear it.
2. Population density and land use (weight 15)
Density is the demand engine for micromobility. Short trips happen where origins and destinations sit close together and parking a car is annoying. Look at people per square mile, but also at land use: a walkable core with mixed residential, retail, offices, and transit stops generates far more short trips than the same population spread across cul-de-sacs.
A 5 is a compact, mixed-use core where a 1 to 2 mile trip replaces a frustrating drive or a long walk. A 1 is low-density sprawl where every useful trip is longer than a scooter ride wants to be. Trace a rough service-area polygon and ask how many real trip pairs fall inside a 15 minute ride. If the answer is few, the density score is low no matter what the citywide population number says.
3. Tourism and trip generators (weight 15)
Tourists and visitors are often the highest-value riders in leisure and destination rental markets. In those markets they ride for fun, they ride midday, and they are less price-sensitive than commuters. This is not universal: commuter, campus, subscription, and B2B fleets often earn their best margins from repeat local riders rather than visitors, so weight this factor for the kind of fleet you are actually building. Beyond tourism proper, count all trip generators: a university, a beachfront or boardwalk, a stadium, a convention center, a large employer campus, a downtown entertainment district, or a resort.
A 5 is a market with a steady, ideally year-round flow of visitors plus fixed anchors that concentrate demand. A 1 has no visitor draw and no anchors, leaving you to rely on residents remembering you exist. Campuses, resorts, and tourist towns often outscore bigger cities here, which is why they make strong first markets. Levy operates rider rentals in 30+ cities across the US and Canada, and the pattern holds: the markets that work have a reason people are already out and moving.
4. Demand signals (weight 15)
Before you commit, gather evidence that demand is real, not just theoretically possible. Useful signals: whether other micromobility operators have run here and how they did, ridership on any local bikeshare or transit, foot traffic in the core, event calendars, and search interest for terms like scooter rental in that city. If a prior operator launched and pulled out, find out whether it was demand, regulation, or their own execution that failed. Those are very different lessons.
A 5 is a market where multiple independent signals all point to real short-trip demand. A 1 is a market where every signal is absent or negative. This is where the Fleet Estimator earns its keep: plug in the city, a realistic fleet size, and your pricing to get projected utilization, revenue, and breakeven, then sanity-check that projection against the outside signals you gathered. If the model and the signals agree, your confidence is high. If they disagree, find out why before you spend.
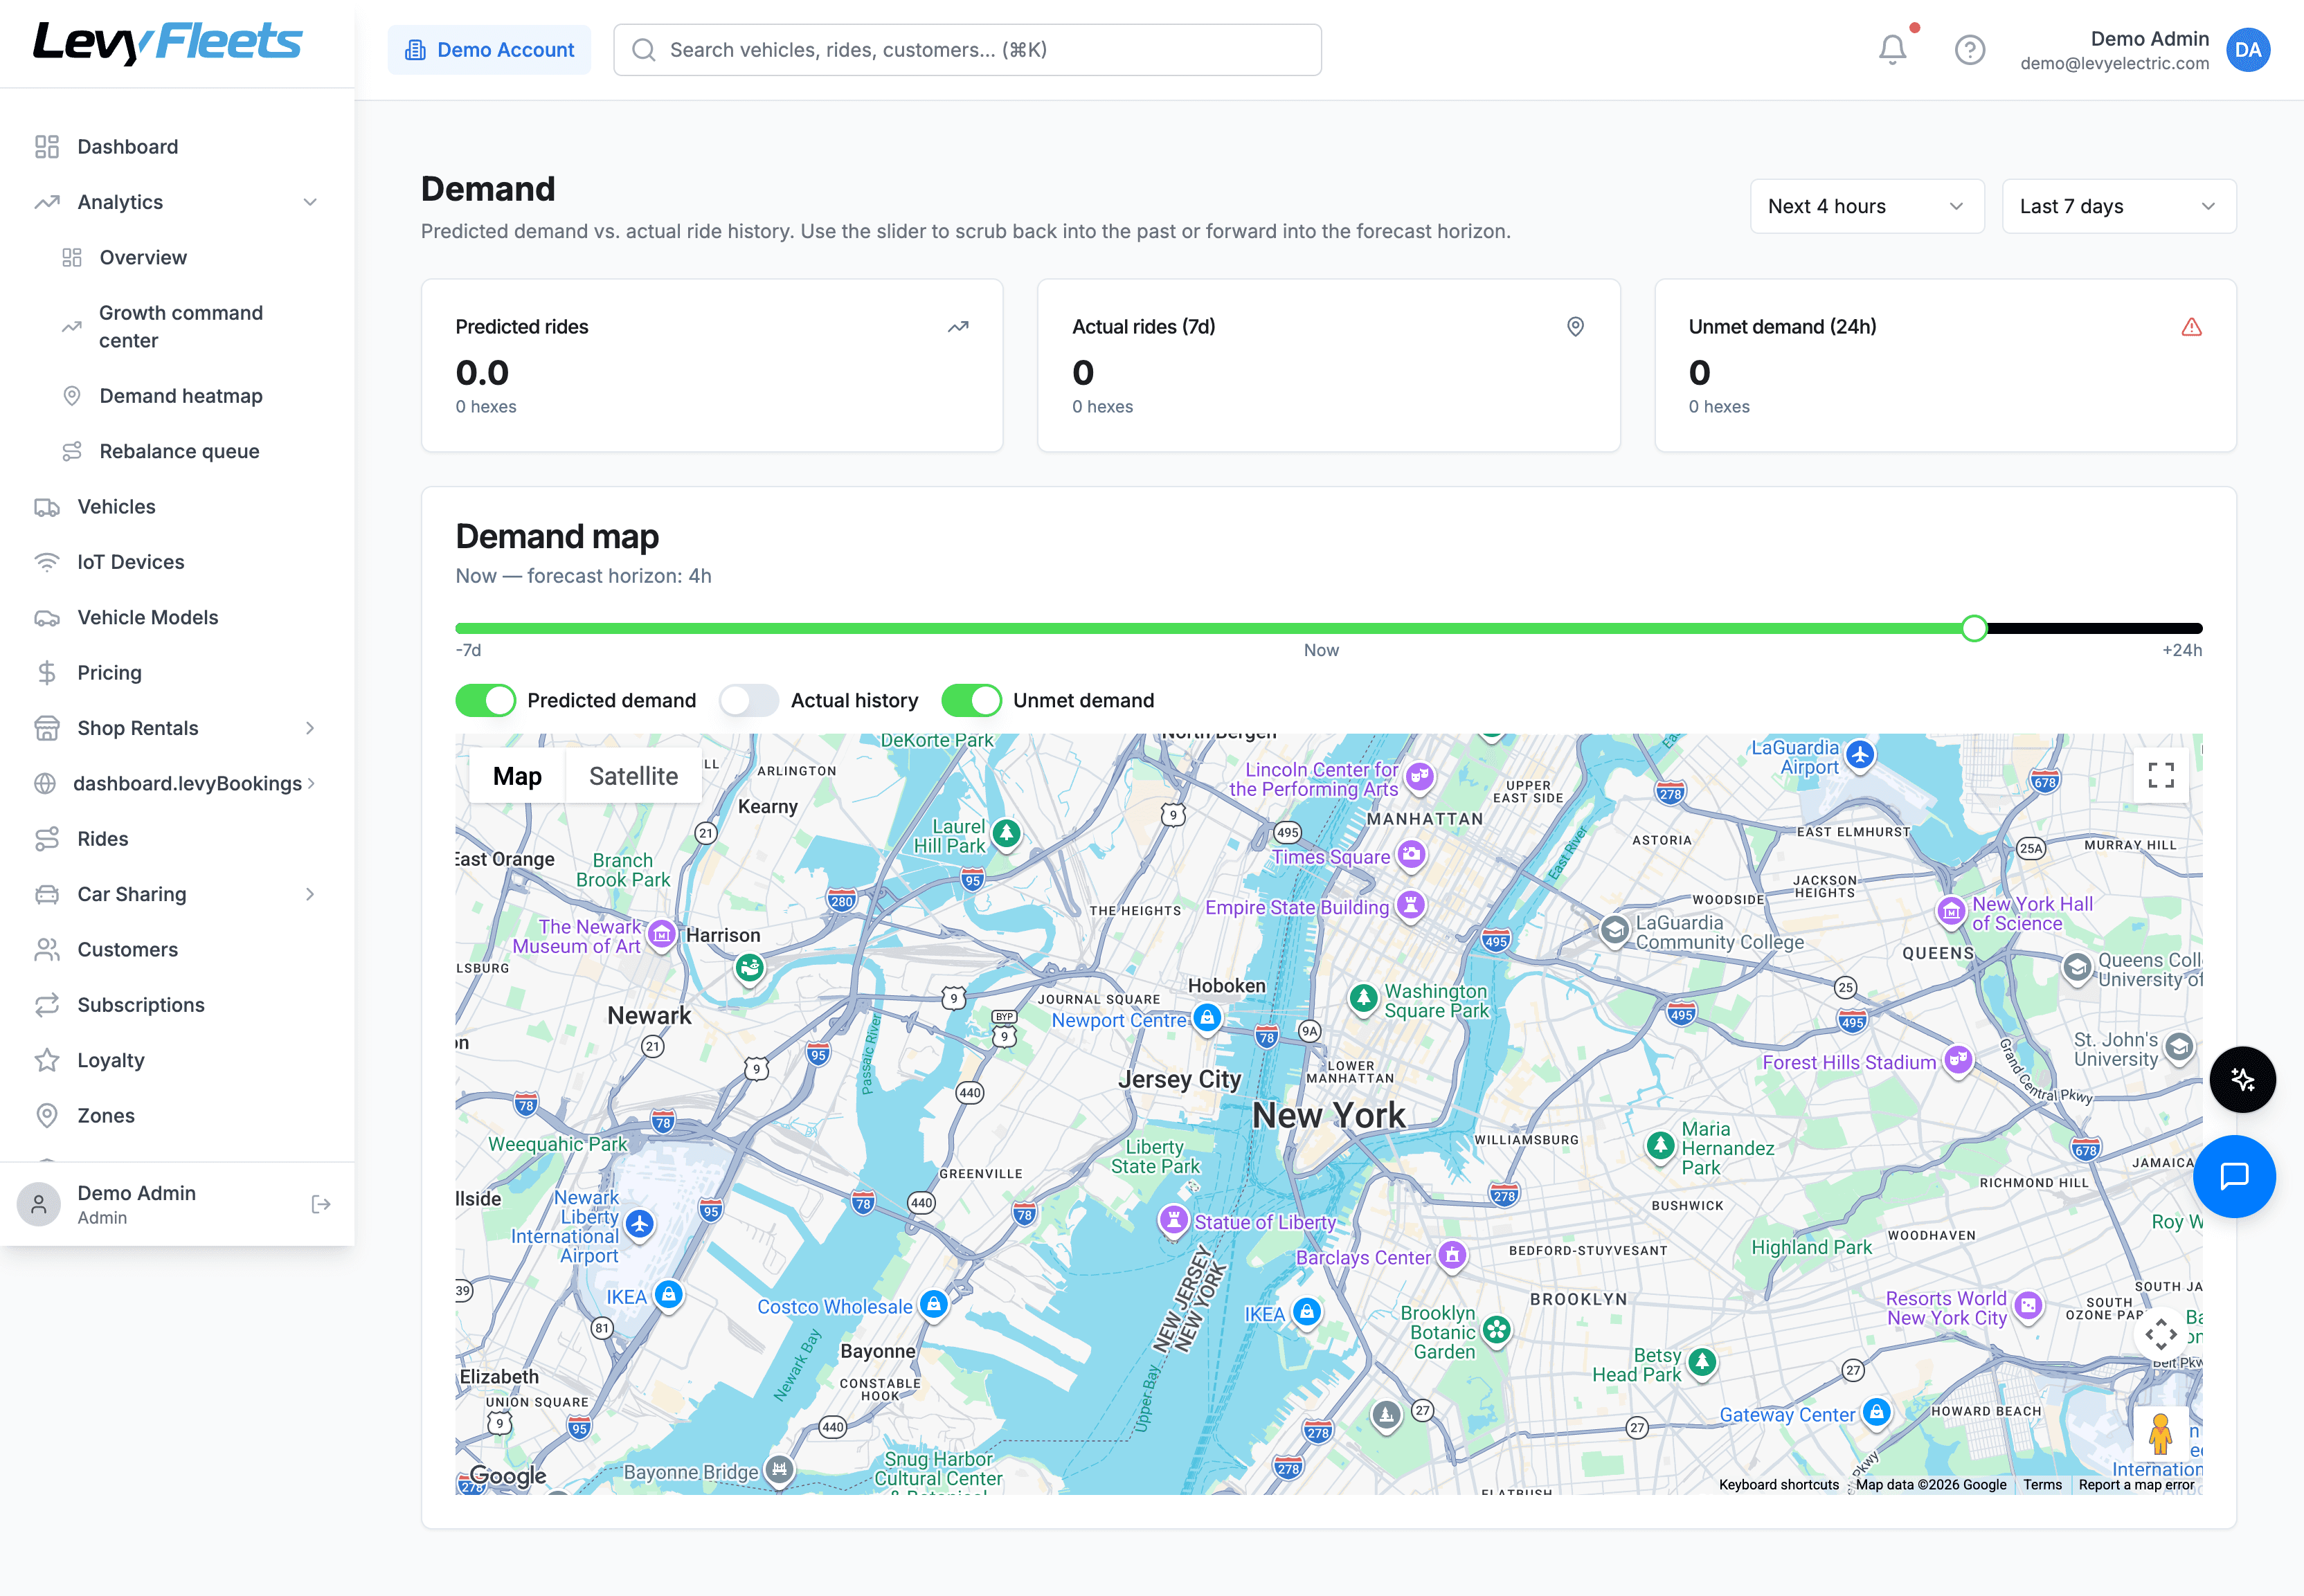
After you launch, Levy's AI Ops add-on turns live rides into demand forecasts (rides per H3 hex over 1, 4, or 24 hour horizons, conditioned on weather and events) and ROI-ranked rebalancing recommendations. It forecasts and recommends only: it does not auto-dispatch vehicles and it is not a surge-pricing engine. For market selection, it tells you where demand actually landed, so your next zone and next market are chosen on data.
5. Competition (weight 15)
Competition cuts both ways. An established operator is proof the market has demand, but it also means you are splitting trips and fighting for the best parking and zones. One entrenched, well-run incumbent is harder to face than an empty market with equal demand. A market with no operators can mean untapped opportunity, or it can mean everyone who tried already left.
A 5 is a market with clear demand and no capable operator serving it well, or a niche (a specific campus, resort, or district) an incumbent is ignoring. A 1 is saturated, with multiple strong incumbents and no room to differentiate. You do not have to beat an incumbent citywide: winning one well-chosen zone or one neglected anchor is often the smarter first-market play.
6. Terrain (weight 8)
Terrain sets both rider experience and your cost to serve. Flat, connected, bike-friendly streets are ideal. Steep hills drain batteries faster, raise your charging and swap frequency, and make lower-powered vehicles frustrating to ride. Rivers, highways, and rail lines that cut a service area into disconnected pieces hurt utilization because vehicles get stranded on the wrong side of a barrier.
A 5 is flat and well-connected. A 1 is steep and fragmented. Terrain is also a hardware decision, and Levy is hardware-agnostic across 30+ IoT vendors, so a hilly market can be matched with higher-powered scooters, e-bikes, or seated mopeds. If terrain is your only weak factor, the right vehicle spec often keeps the market viable.
7. Weather and season (weight 7)
Weather sets your riding calendar. A long temperate season with little heavy rain or snow gives you more revenue days per year. A hard winter or a long rainy season compresses your earning window and forces you to plan for storage, reduced fleets, or a seasonal shutdown.
A 5 is a mild, long-season climate. A 1 is a short, harsh season. Weather is weighted lightly because a strong tourist or campus market can be highly profitable even in a short season, and because Levy's revenue-share, pay-when-riders-pay model means a slow off-season costs you far less than a fixed software contract would. Keep the platform minimum in mind, though: the $250 per month operator minimum is a real floor, so a market that only earns for four months a year still needs those months to carry the year.
The weighting framework: how to score
The weights encode the lesson that some factors can kill a market and others only shade it. Regulation is weighted highest because a closed market is worth nothing. Terrain and weather are weighted lowest because the platform and hardware give you levers to manage them.
Score each factor 1 to 5, then convert to weighted points with a simple formula so a perfect market tops out at 100:
weighted points = (your 1 to 5 score divided by 5) times the factor weight
| Factor | Weight | What a 5 looks like |
|---|---|---|
| Regulatory friendliness | 25 | Open permit window, sane cap, no revocation history |
| Population density and land use | 15 | Compact, mixed-use core with real 1 to 2 mile trips |
| Tourism and trip generators | 15 | Steady visitor flow plus anchors that concentrate demand |
| Demand signals | 15 | Independent signals confirm short-trip demand |
| Competition | 15 | Clear demand, no capable operator, or an ignored niche |
| Terrain | 8 | Flat, well-connected, no barriers splitting the area |
| Weather and season | 7 | Mild, long season with few washout days |
| Total | 100 |
Read the total against these bands:
- 80 to 100: Strong launch candidate. Move to due diligence and modeling.
- 60 to 79: Workable, usually by shrinking scope to a tight, high-scoring zone.
- Below 60: Keep looking, or narrow to a single anchor and re-score that footprint.
Score the zone, not just the city
Citywide averages hide winners. A sprawling metro can score 55 overall but contain one dense, permit-friendly, tourist-heavy district that scores 85. Re-run the scorecard on the tightest footprint you would actually launch, and a strong first market often appears inside a mediocre city.
Score two markets side by side
Here is the framework applied to two candidates: Market A, a compact coastal tourist town with an open permit process, and Market B, a spread-out inland suburb where you already live.
| Factor | Weight | Market A score | A points | Market B score | B points |
|---|---|---|---|---|---|
| Regulatory friendliness | 25 | 4 | 20.0 | 3 | 15.0 |
| Density and land use | 15 | 5 | 15.0 | 2 | 6.0 |
| Tourism and trip generators | 15 | 5 | 15.0 | 1 | 3.0 |
| Demand signals | 15 | 4 | 12.0 | 2 | 6.0 |
| Competition | 15 | 3 | 9.0 | 5 | 15.0 |
| Terrain | 8 | 4 | 6.4 | 3 | 4.8 |
| Weather and season | 7 | 3 | 4.2 | 4 | 5.6 |
| Total | 100 | 81.6 | 55.4 |
Market A wins clearly, 81.6 to 55.4, even with more competition and a shorter season, because it is strong on the factors that set the demand ceiling. Market B scores well on competition (nobody is there), but low density and zero trip generators cap its demand no matter how well you execute. The scorecard just told you to launch where the riders are, not where your house is.
Pressure-test your top pick before you commit
A high score is a shortlist, not a decision. Confirm it before you spend.
Confirm the regulatory path
Read the actual permit language or property rules. Verify the window is open, note the cap and any per-vehicle fee, and confirm you can meet the feed and enforcement requirements. If the city expects MDS or GBFS feeds, that is a fit for Levy's city compliance tooling, so treat it as a checklist, not a blocker.
Model the unit economics
Run your top market through the Fleet Estimator with a realistic first-season fleet size and your pricing. Confirm projected revenue per vehicle per day clears your daily cost stack and that breakeven lands at a rides-per-day number your demand signals support.
Walk the zone
Trace the service area on foot. Confirm the density, trip generators, parking, and terrain match what you scored from a desk, and note where you would seed vehicles and where riders would naturally end trips.
Right-size the vehicle mix
Because Levy is hardware-agnostic across 30+ IoT vendors, spec scooters, e-bikes, or mopeds to fit the terrain and trip length rather than forcing one vehicle onto every market.
Plan the compliance zones
Lay out your geofenced service area, parking zones, no-go areas, and speed-limit zones before launch so enforcement is live on day one, not bolted on after the first complaint.
Common first-market mistakes
- Launching where you live instead of where the demand is. Convenience is not a demand signal. Score honestly even if it means operating an hour away.
- Ignoring regulation until after you have bought vehicles. A closed permit window turns a fleet into inventory. Confirm the path first.
- Chasing an empty market. No operators can mean no demand, not free demand. Find out why it is empty before assuming it is opportunity.
- Buying vehicles before modeling the market. The math is cheap and the hardware is not. Model first in the Fleet Estimator, then buy.
FAQs
Put the scorecard to work
Market selection is not a coin flip. It is seven factors, honest 1 to 5 scores, and a weighting that leans hardest on the things that can kill a market. Score your shortlist, re-score the tightest footprint inside your top pick, then confirm the two decisions that cost real money: the regulatory path and the unit economics.
Ready to move from shortlist to decision? Model your top market in the Fleet Estimator to see projected utilization, revenue, and breakeven, and read the step-by-step guide to starting an electric scooter rental business for the full launch playbook behind the market you choose.
See the platform for your market
Book a demo to see how Levy handles IoT, payments, compliance, and 24/7 managed support for the market you pick, with $0 upfront and revenue share.