.svg)
Every vehicle on the street costs you money every day, whether it earns a ride or not. Breakeven utilization is the single number that tells you how many rides each vehicle must complete per day just to cover that daily cost. Get it wrong and you scale losses. Get it right and you know, before you deploy a single unit, exactly what demand a zone has to produce to pay for itself. This worksheet walks you through the formula with a worked scooter example, then hands you blank fields to run your own numbers. Keep a copy open next to the Fleet Estimator so you can sanity-check every figure you enter.
Planning tool, not financial advice
This worksheet is an operator planning aid, not financial, tax, accounting, or legal advice. Every dollar figure here is illustrative, and the pricing math is deliberately simplified into a conservative floor (see Step 2). Confirm your real costs, your exact revenue split, and your tax treatment with a qualified professional and against Levy's current terms before you commit capital.
The one formula that matters
Breakeven rides per vehicle per day is a division problem:
Breakeven RVD = Daily cost stack per vehicle / Net revenue kept per ride
The top of the fraction is everything it costs you to keep one vehicle deployed for one day. The bottom is what you actually pocket from an average ride after payment processing and your Levy revenue share. Divide the two and you get the rides per vehicle per day that put you at zero. Anything above that line is vehicle-level contribution (toward your business-level costs, not yet profit). Anything below it is a subsidy you are paying out of your own capital.
Two inputs, one answer. The rest of this worksheet is about getting those two inputs honest.
Step 1: Build your daily cost stack per vehicle
List every recurring cost per vehicle
Add up what one vehicle costs you across a normal operating day. The six lines below cover most shared-mobility fleets. Spread anything that is not already daily (a monthly SIM plan, a quarterly tire replacement) down to a per-day figure.
Amortize the hardware honestly
Take the delivered vehicle cost, divide by the number of days you realistically expect it to earn, and that is your hardware line. Levy does not manufacture vehicles, so use your actual sourced cost. A vehicle you retire early has a higher daily amortization than the same unit run to end of life.
Total the stack
Sum the six lines into one number: your daily cost stack per vehicle. This is the top of the breakeven fraction.
| Cost line | What it covers | Your figure (per vehicle per day) |
|---|---|---|
| Hardware amortization | Delivered vehicle cost spread over its useful earning life | $ ____ |
| Charging or battery swap | Energy, swap labor, or Juicer bounties | $ ____ |
| Maintenance and repairs | Parts and labor (Levy stocks common OKAI and Segway parts in the US for days-not-weeks turnaround) | $ ____ |
| IoT connectivity | The cellular SIM that keeps the vehicle connected | $ ____ |
| Field labor | Rebalancing, cleaning, deployment, and pickup | $ ____ |
| Processing and platform | Payment fees and your Levy platform allocation | $ ____ |
| Daily cost stack | Sum of the six lines above | $ ____ |
Small fleets: mind the $250 monthly minimum
Levy's platform minimum is $250 per operator per month, credited against your revenue-share fees. If a slow month generates less than $250 in fees, Levy invoices the difference. At very small fleet sizes, spread that floor across your vehicles and add it to the processing and platform line, or your breakeven will read lower than reality.
Step 2: Find your net revenue kept per ride
The bottom of the fraction is what you keep from a typical ride, not the gross fare the rider pays. Two things come out before the money is yours.
- Payment processing. Levy passes through Stripe at volume pricing of 2.6% plus $0.20 per transaction (versus the standard 2.9% plus $0.30). Processing costs are shared proportionally between you and Levy, but for a conservative floor, subtract the full Stripe fee from your average fare.
- Your Levy revenue share. On the Managed plan, Levy's fee is 20% of GMV under 100 active vehicles (15% of GMV at 100 to 249 vehicles on an annual or approved term). Your partner share is the complement: 80% by default. GMV is gross rider payments before taxes, government fees, refunds, and tips.
Subtracting the full 20% and the full Stripe fee straight off the gross fare gives you a conservative floor, not an exact net figure. In Levy's actual terms the Managed fee is quoted on GMV (gross), while your payout base is net revenue after Stripe, with processing costs shared proportionally, so your real net per ride is usually a little higher than this floor. Plan against the floor to stay safe, then let the Fleet Estimator resolve the exact operator split for your plan and volume.
Two money flows, not one
Levy's Managed fee is quoted on gross GMV, while payment processing is a separate deduction shared proportionally. Do not stack them into a single blended percentage in your head, and do not treat the floor below as your precise net. Compute each from the gross fare, subtract both for a conservative floor, and let the Fleet Estimator confirm the exact operator split.
Fill in your own average ride. The bottom line is a conservative floor, so treat it as a safe lower bound on what you keep:
| Ride economics | Your figure |
|---|---|
| Average gross fare (GMV per ride) | $ ____ |
| Less Stripe processing (2.6% plus $0.20) | $ ____ |
| Less Levy Managed fee (20% of gross fare) | $ ____ |
| Net revenue kept per ride (conservative floor) | $ ____ |
Step 3: Divide and read your breakeven
Take your daily cost stack from Step 1, divide by your net revenue kept per ride from Step 2, and you have your breakeven rides per vehicle per day. Round up: a vehicle at 0.9 of its breakeven is still losing money.
Daily cost stack $ ____ / Net revenue kept per ride $ ____ = Breakeven RVD ____
Worked example: an urban kick scooter
Here is the full calculation with illustrative numbers. Replace every figure with your own; these are placeholders to show the mechanics, not Levy benchmarks.
Daily cost stack
| Cost line | Example figure |
|---|---|
| Hardware amortization | $1.50 |
| Charging or battery swap | $0.40 |
| Maintenance and repairs | $0.60 |
| IoT connectivity | $0.10 |
| Field labor | $1.20 |
| Processing and platform | $0.20 |
| Daily cost stack | $4.00 |
Net revenue kept per ride (conservative floor)
- Average gross fare: $4.75
- Stripe processing: 2.6% of $4.75 is about $0.12, plus $0.20, so $0.32
- Levy Managed fee: 20% of $4.75 is $0.95
- Net kept per ride (conservative floor): $4.75 minus $0.32 minus $0.95 equals $3.48
Remember this $3.48 is a floor. It charges you the full Stripe fee and the full 20% off gross, so your real net per ride is usually a bit higher (the Managed fee is quoted on GMV and processing is shared proportionally). A higher net per ride means a slightly lower breakeven, so treating $3.48 as the floor keeps your breakeven on the safe, conservative side.
Breakeven
- $4.00 / $3.48 equals about 1.2 rides per vehicle per day
In this example each scooter needs roughly 1.2 rides a day to cover its six-line operating stack. That is a useful anchor: if the zone reliably produces more rides than that per vehicle, every additional ride throws off vehicle-level contribution. If it does not, the vehicle is a drag no matter how clean the app looks.
Contribution, not profit
This breakeven covers only the six per-vehicle operating lines above, so clearing it means each unit is contributing, not that your business is profitable. Business-level costs that do not attach to a single vehicle still sit on top: insurance, city permits and fees, storage or depot rent, marketing, income and sales taxes, a theft and loss reserve, and owner overhead. Fold those into a separate business model when you size the whole operation, and never read a per-vehicle contribution line as net profit.
Stress-test the downside
A single breakeven number hides how fragile it can be. Small moves in fare or cost stack swing the answer more than operators expect, and the worst months are exactly when both drift the wrong way at once. Run a few downside cases before you trust one point estimate. The table below flexes the worked example (daily cost stack $4.00, net floor $3.48 per ride) so you can see the shape. These are illustrative moves, not Levy forecasts, so your own sensitivities will differ: model them in the Fleet Estimator.
| Downside case | What changes | Net floor per ride | Breakeven RVD |
|---|---|---|---|
| Base (worked example) | Cost stack $4.00, fare $4.75 | $3.48 | about 1.2 |
| Fare softens 20% | Fare drops to $3.80 | about $2.74 | about 1.5 |
| Cost stack rises 25% | Stack climbs to $5.00 (repair spike, theft) | $3.48 | about 1.4 |
| Both at once | Fare $3.80 and stack $5.00 | about $2.74 | about 1.8 |
Notice that a fare cut and a cost overrun stack up fast: hit both and breakeven climbs from about 1.2 to about 1.8, half again as many rides per vehicle just to stay flat. That is why a zone that pencils out at plan can go underwater on a bad-weather month or a repair spike. Build the downside in before you deploy, not after.
Run it for your vehicle type
The same formula holds across your fleet, but the inputs shift. Heavier, pricier vehicles carry a bigger daily cost stack and usually a higher fare, so their breakeven RVD often lands lower even though each unit costs more to run. Use the tabs as a starting frame, then overwrite every number.
Lower hardware cost, lower fare, higher touch. Expect a modest daily cost stack (charging and rebalancing dominate) against a low average fare, like the worked example above. Field labor is usually your biggest single line, so tightening rebalancing routes moves breakeven the most.
Turn breakeven into decisions
Once you know your breakeven RVD, it becomes a filter for almost every operating call you make.
- Deployment zones: a zone that cannot clear breakeven RVD should not get vehicles until demand or pricing changes.
- Pricing: raising the average fare lifts net revenue kept per ride, which lowers breakeven. Model the change before you ship it.
- Cost discipline: cutting field labor or extending hardware life shrinks the daily cost stack, again lowering breakeven.
- Fleet sizing: never add vehicles to a market running below breakeven. More units multiply the loss, they do not average it away.
Revisit these two inputs every quarter. Hardware costs, energy prices, and your average fare all drift, and a breakeven number from six months ago can quietly stop being true.
Frequently asked questions
Model it before you deploy
A worksheet gives you the mechanics; a model gives you the confidence. Once you have your daily cost stack and net revenue kept per ride, plug your city, fleet size, and pricing into the Fleet Estimator to see projected utilization and revenue against this breakeven line, then read the full scooter rental profitability breakdown for the assumptions behind those projections. With Levy's $0-upfront, revenue-share model, you pay when riders pay, so the sooner you know your breakeven, the sooner you know which zones are worth the hardware.
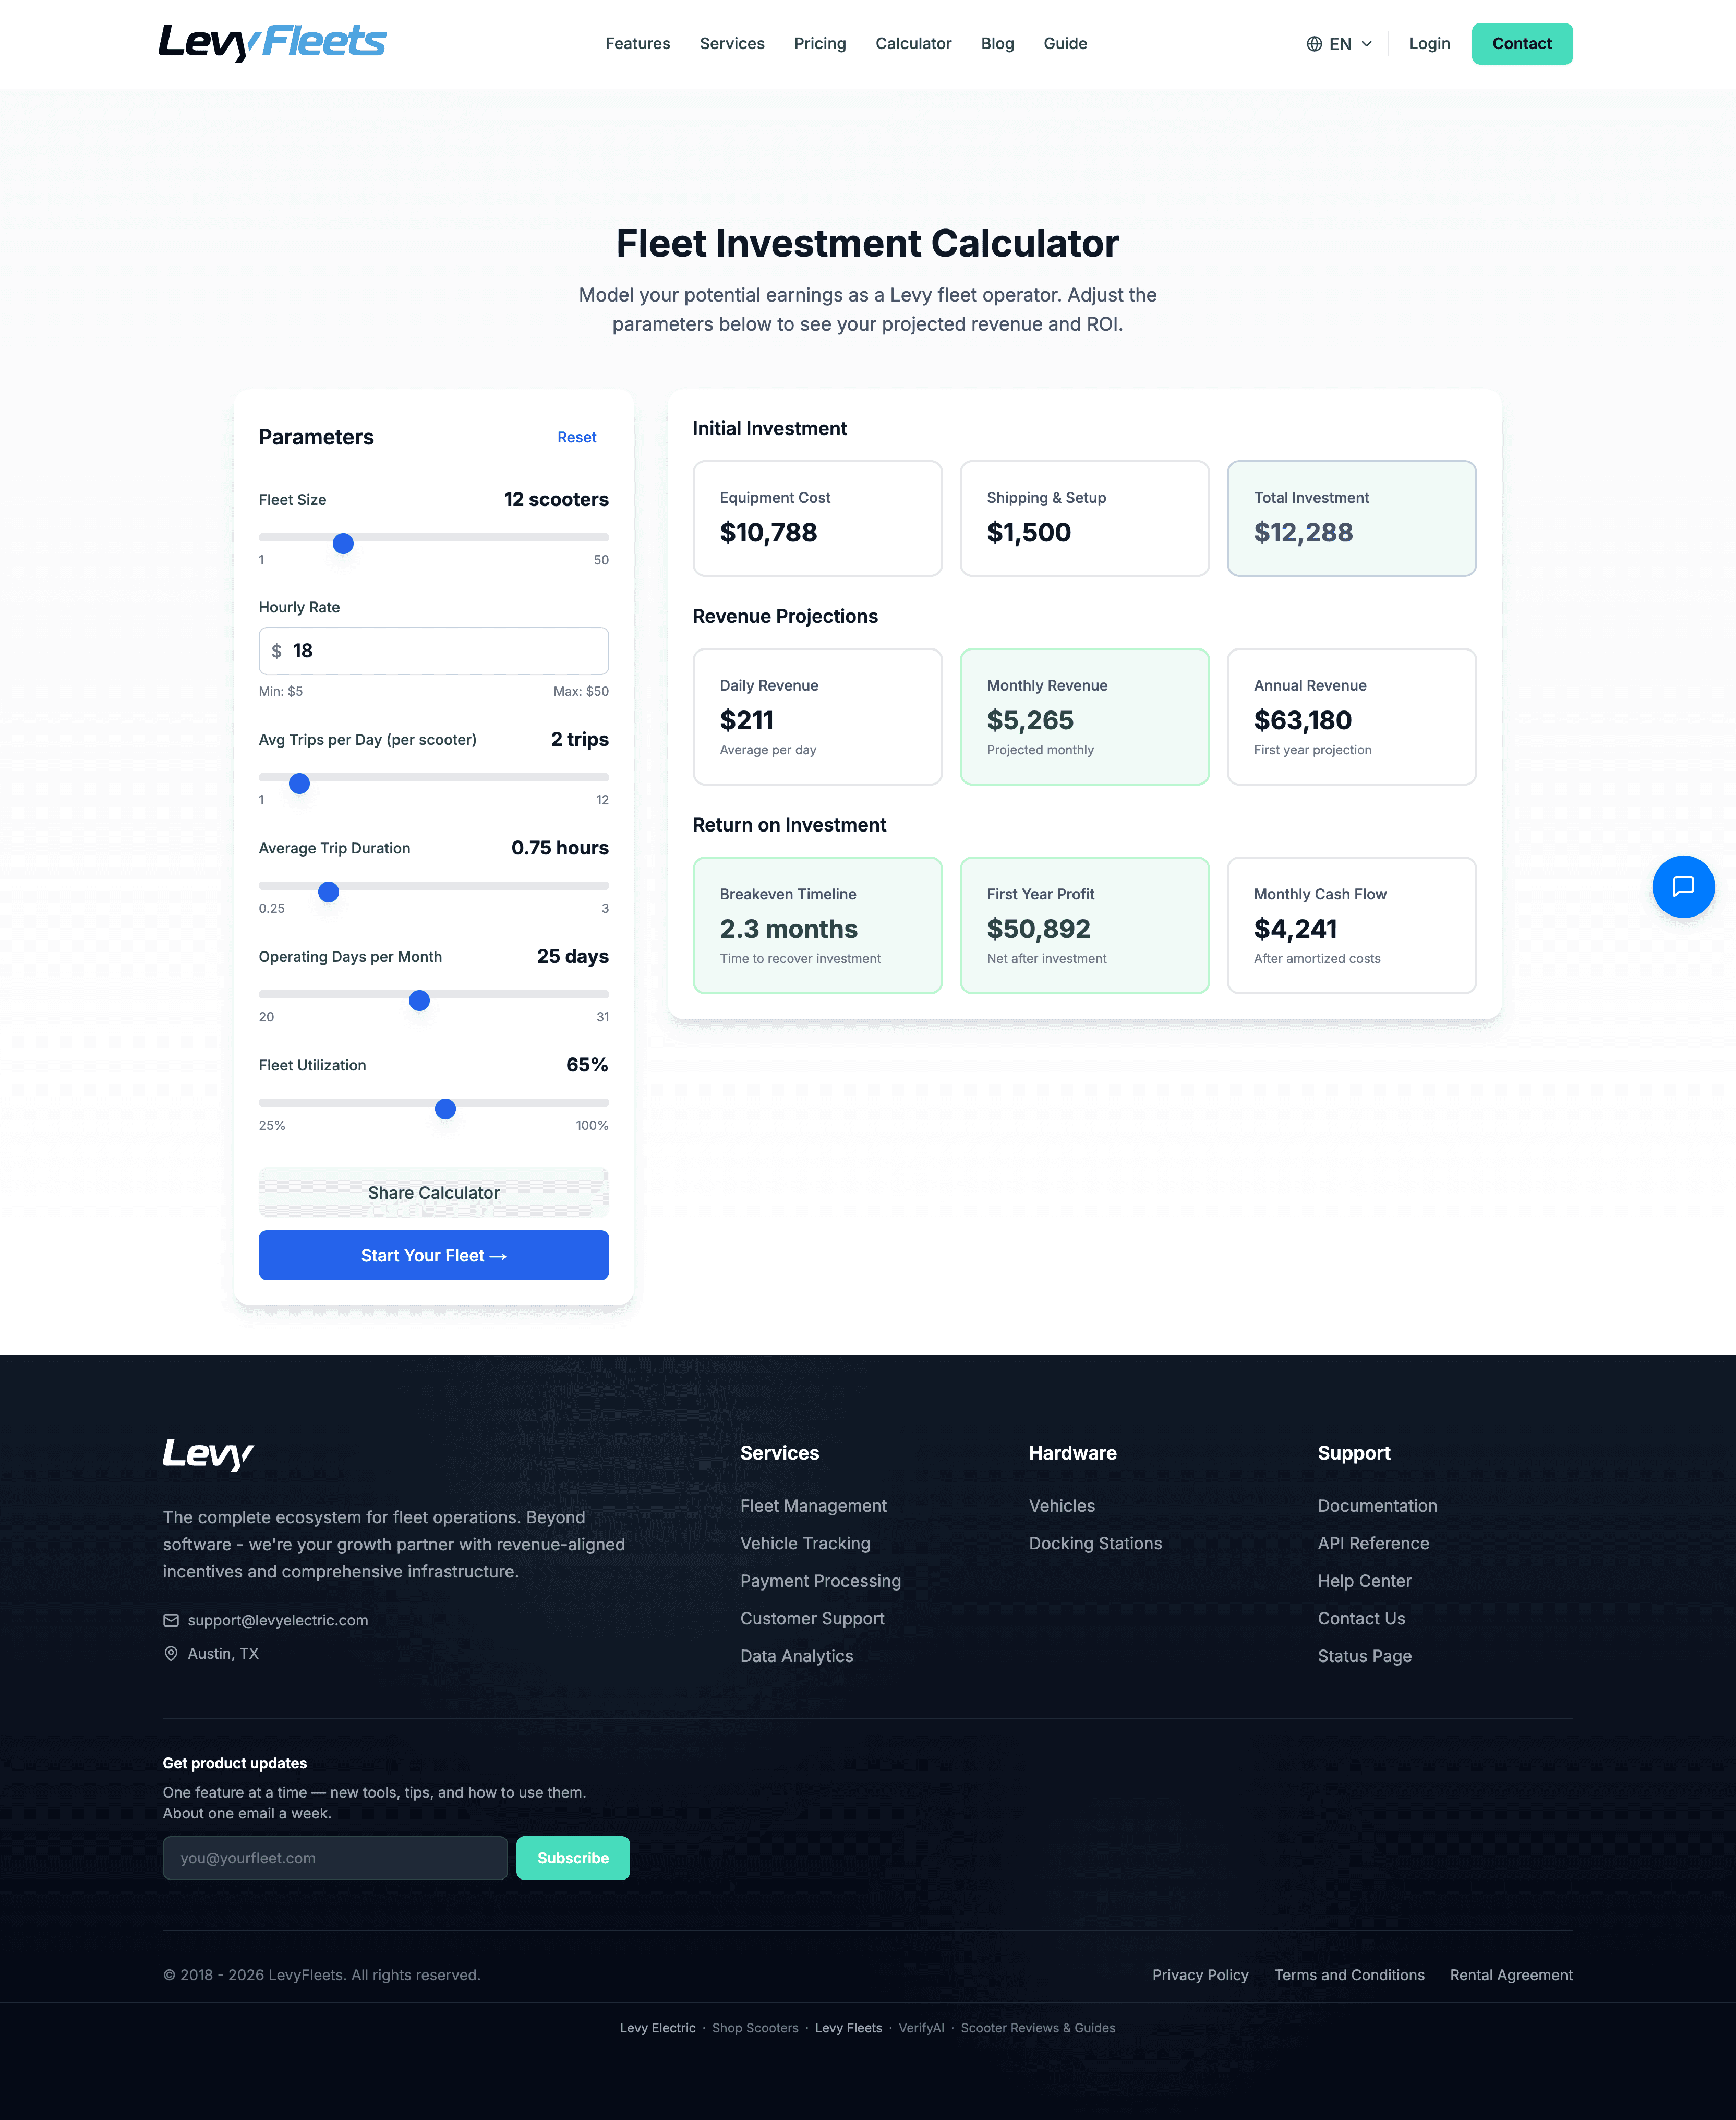
Run your numbers in the Fleet Estimator
Enter your market, fleet size, and pricing to project utilization, revenue, and breakeven against your own cost stack.