.svg)
The old playbook for shared electric mobility was simple: put more vehicles on the street and wait for riders to find them. That worked well enough when the industry was young, capital was cheap, and the main goal was to prove that people would ride scooters, e-bikes, mopeds, and other light electric vehicles for short urban trips.
That phase is over.
Shared micromobility has become real transportation infrastructure. NABSA reported at least 225 million shared micromobility trips across North America in 2024, and NACTO reported 150 million shared bike and scooter trips in member cities in 2025. Those are no longer novelty numbers. They describe a mature operating category with the same hard questions every transportation system faces:
- Where is demand actually forming?
- Which vehicles are earning, and which are just occupying space?
- When should an operator add vehicles versus move the ones they already have?
- Which neighborhoods are under-supplied, over-supplied, or constrained by dead batteries, maintenance, or offline hardware?
- How can a city get reliable mobility without inviting avoidable sidewalk clutter?
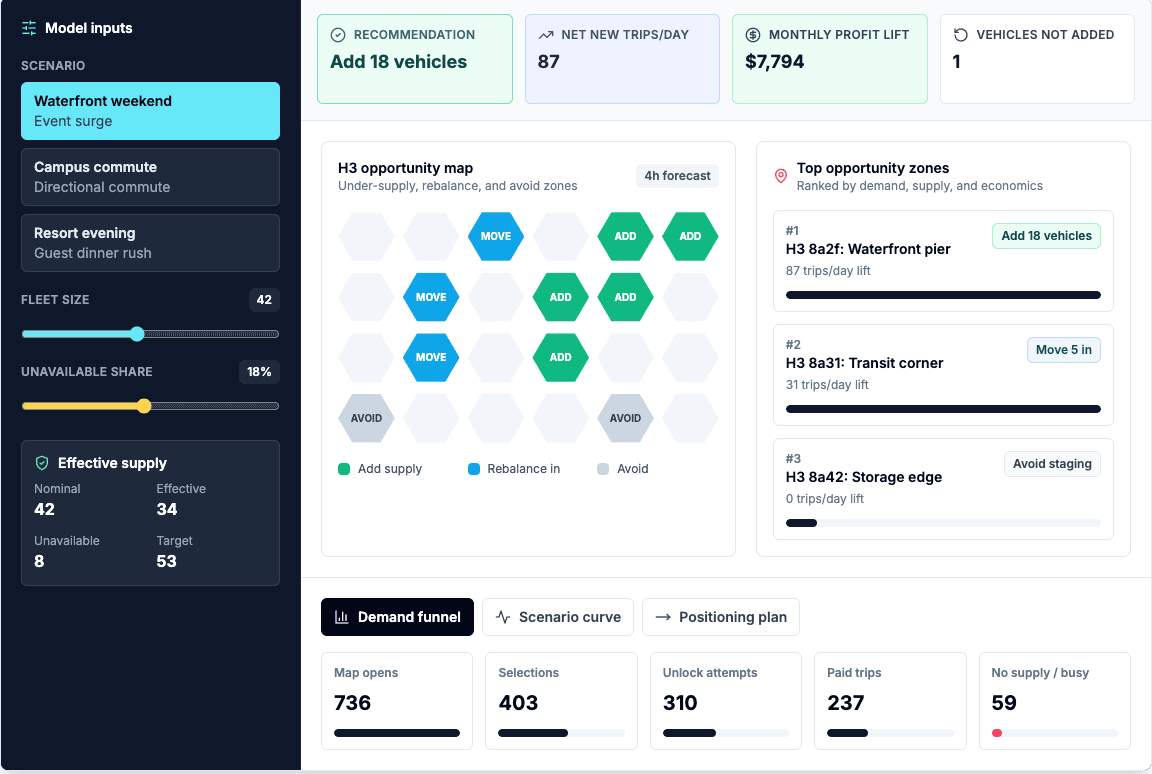
Levy's new demand management feature set was built for that operating reality. Inside the Levy dashboard, the Growth Command Center and AI Ops tools turn rider intent, vehicle availability, trip history, and local economics into concrete expansion and positioning recommendations.
The goal is not to flood a market with more scooters. The goal is to put the right number of vehicles in the right places, validate the lift, and avoid adding supply where demand does not support it.
What Demand Management Means
Demand management is the operating layer between a rider opening the app and an operator deciding what to do next.
A traditional dashboard tells you what already happened: rides completed, revenue collected, utilization by vehicle, and maybe a heat map of past trip starts. That is useful, but incomplete. The rides table only shows successful demand. It does not show the rider who opened the app, saw no vehicle nearby, and left. It does not show a neighborhood where every nearby scooter was low-battery, in use, or offline. It does not tell you whether adding ten more scooters would create more trips or just more idle inventory.
Levy Demand Management is designed to answer the next question:
What should the operator do with this signal?
The system connects several pieces of fleet intelligence:
- Demand funnel telemetry - rider map opens, scan starts, vehicle selections, unlock attempts, blocked unlocks, and paid trip completions.
- Unmet demand - places where riders searched but no rideable vehicle was available nearby.
- Supply constraints - the gap between nominal fleet size and effective fleet size after low battery, maintenance, offline, and in-use vehicles are accounted for.
- Opportunity zones - H3 map cells ranked by whether the best next action is to add vehicles, recover availability, rebalance, hold, or collect more data.
- Positioning plans - daily action plans for where to stage, recover, rebalance, avoid, or watch.
- Expansion forecasts - modeled added trips, revenue, contribution profit, payback, saturation, and first-bet recommendations before buying more vehicles.
- Scenario comparison - side-by-side views of capacity additions, right-sized first bets, recover-versus-buy decisions, pricing-only levers, and rebalancing-only levers.
That makes the feature different from a heat map. A heat map says, "Rides happened here." Demand management says, "Here is where demand is forming, here is why it is constrained, and here is the smallest action worth testing."
What The Dashboard Shows Operators
The product output is intentionally concrete. An operator should not have to translate a chart into a field plan by hand.
In the Growth Command Center, Levy can show:
- How many vehicles to add - the modeled capacity addition, the profit-maximizing point, and the smaller first-bet recommendation when a reversible test is wiser than a full expansion.
- Where to place them - H3 opportunity zones and placement recommendations that rank the highest-demand, most supply-constrained areas.
- How many trips the move may create - expected incremental trips, revenue, and contribution profit over the modeled period, with confidence bands and forecast accuracy context.
- When not to add vehicles - recommendations to recover unavailable vehicles, rebalance existing supply, hold, or collect more data when demand does not support a purchase.
- What to do today - a positioning plan for staging, recovery, rebalancing, avoid zones, and watchlist areas that field teams can act on before the next demand window.
That is the operating difference. The dashboard is not only reporting that utilization is high or low. It is translating demand into a decision: buy, move, recover, hold, or test.
The Problem With Counting Only Completed Trips
Completed trips are an important metric, but they are a biased sample. They only include demand that had enough supply available to convert.
In a constrained fleet, the most valuable demand can be invisible. A rider opens the app near a hotel, train station, waterfront, campus, or event venue. If the nearest available vehicle is too far away, the rider does not show up as a lost ride in the revenue report. They show up as nothing.
This is why Levy tracks demand before it becomes a ride. The demand funnel looks at app sessions and rider actions before payment:
1. A rider opens the app or map.
2. The rider views nearby vehicles or a service area.
3. The rider selects a vehicle or scans a QR code.
4. The rider attempts to unlock.
5. The ride succeeds, fails, or is blocked.
6. The trip completes and generates paid revenue.
When that funnel breaks, the reason matters. There is a big difference between "nobody wanted to ride here" and "people wanted to ride here, but there were no available vehicles." There is also a difference between "we need more scooters" and "we need to recover the scooters we already own from low battery, maintenance, or offline status."
Demand management exists because those are not academic distinctions. They decide whether an operator spends money on new vehicles, dispatches a technician, changes pricing, moves supply, or leaves a zone alone.
Right-Sized Growth Beats Overdeployment
For cities, overdeployment looks like sidewalk clutter. For operators, it looks like bad unit economics.
Too many vehicles in the wrong place create storage problems, complaints, retrieval costs, and low utilization. Too few vehicles in the right place create missed trips, disappointed riders, and invisible revenue leakage. The profitable path is usually not maximum fleet size. It is effective fleet size matched to observed and forecast demand.
Levy's Growth Command Center is built around that distinction.
The dashboard can recommend several different actions:
| Recommendation | What it means | Why it matters |
|---|---|---|
| Buy more | Demand and economics support added fleet capacity | Growth is likely supply-constrained, not just poorly positioned |
| Recover availability first | Existing vehicles are offline, in maintenance, low battery, or otherwise unavailable | Buying more vehicles would hide an operations problem |
| Rebalance first | Vehicles exist, but they are staged in the wrong places | Moving supply is cheaper and faster than buying supply |
| Do not buy | Current demand does not justify more vehicles | Prevents avoidable idle inventory and street clutter |
| Collect more data | The signal is too thin or low-confidence | Avoids making a capital decision from weak evidence |
That is the core of demand-responsive fleet management: the software should be willing to say "do not add vehicles yet."
How The Growth Command Center Works
The Growth Command Center lives in Dashboard > Analytics > Growth. It is a planning workspace for operators deciding how to expand or tune a fleet.
At a high level, it combines four views:
1. Demand visibility - how rider intent moves through the funnel from app open to paid ride.
2. Supply constraints - whether the current fleet is available, effective, and close enough to demand.
3. Expansion forecasting - what happens if the operator adds a selected number of vehicles.
4. Operational planning - whether the better next action is adding vehicles, recovering vehicles, rebalancing, pricing, or collecting more data.
Under the hood, Levy maps demand and supply into H3 zones, which are consistent hexagonal map cells. H3 lets the system compare different signals in the same geography: searches, unmet demand, completed trips, effective vehicles, nearby availability, average distance to a vehicle, revenue per trip, and supply states like offline, maintenance, and low battery.
The result is a growth view that can answer practical operator questions:
- If I add 10 scooters, how many incremental trips might I see?
- What is the modeled monthly contribution profit?
- Where should the first added vehicles go?
- Is there a profit-maximizing fleet size before saturation?
- Should I recover unavailable vehicles before buying more?
- Which zone should I stage vehicles in today?
- Which zone should I avoid because supply is already high relative to demand?
The system also exposes confidence, source quality, and forecast accuracy. That matters because demand forecasting should not pretend to be certain. If the signal is weak, the right answer is a smaller reversible test, not a large purchase order.
The "First Bet" Philosophy
One of the most important outputs is the first bet.
Instead of telling an operator to immediately buy the maximum number of modeled vehicles, Levy can recommend a smaller test size and duration. For example, the dashboard may say that the first bet is to add a limited number of scooters for a defined window, then measure whether actual trips, revenue, and availability match the forecast.
That is a healthier way to grow. It treats expansion as an experiment with controls, not a guess.
A first bet should be:
- Small enough to reverse or adjust.
- Large enough to create a measurable change.
- Placed in zones with clear demand and supply evidence.
- Measured against the forecast after the test window.
- Compared against lower-cost alternatives like recovering availability or rebalancing.
This is especially important for seasonal markets, tourist districts, campuses, hotels, resorts, and smaller cities. Demand can be real but highly time-bound. Adding permanent supply for a temporary spike can create clutter and idle cost. The first-bet workflow helps operators prove the signal before scaling it.
Example: A Weekend Waterfront Market
Imagine a waterfront district where riders search for scooters every Friday afternoon and Saturday morning. The rides table shows only moderate demand, so a simple report might tell the operator not to add vehicles.
The demand funnel tells a different story:
- Map opens spike near the waterfront.
- No-supply searches increase between 4 PM and 8 PM.
- Completed trips stay flat because there are not enough available vehicles nearby.
- A nearby residential zone has idle supply during the same window.
- Several nominal vehicles are low-battery or offline, so the effective fleet is smaller than the operator thinks.
A traditional growth plan might say "buy more scooters." Levy Demand Management may produce a more precise sequence:
1. Recover offline and low-battery vehicles first.
2. Rebalance three to five scooters from the residential zone into the waterfront zone before the Friday spike.
3. Watch the app-to-paid conversion rate and completed trips.
4. If unmet demand persists after availability improves, run a first-bet expansion with a specific number of added vehicles.
5. If the added vehicles lift trips and contribution profit as forecast, scale. If not, hold.
That is a better outcome for everyone. Riders see vehicles where they need them. Operators earn more from the fleet they already own. Cities see less unnecessary clutter because the operator is not solving every demand problem with more vehicles.
Demand Management Is A City-Facing Story Too
Cities are not only asking whether shared micromobility works. They are asking whether it can be managed responsibly.
The Open Mobility Foundation's Mobility Data Specification and related public data standards exist because cities need visibility into shared mobility operations. GBFS and MDS serve different but complementary roles: riders and trip planners need discoverable vehicle availability, while regulators need operational and compliance data.
Demand management fits into that same evolution. A well-run electric fleet should be able to explain:
- Why vehicles were placed in a neighborhood.
- Whether a deployment matched observed demand.
- How the operator responds to under-supplied and over-supplied zones.
- Which areas are receiving service and which are being ignored.
- How the operator prevents oversupply from turning into clutter.
The point is not just better internal analytics. It is better accountability.
When an operator can show that it added vehicles because observed rider demand, unmet searches, and effective supply constraints justified the decision, the conversation with a city changes. The operator is no longer saying, "Trust us, we need more devices." It is saying, "Here is the demand signal, here is the deployment plan, here is the confidence level, and here is how we will validate it."
What Makes This Different From Generic AI
AI is easy to overstate in mobility. A model that predicts demand is not useful by itself. The useful part is the operating loop around the prediction.
Levy Demand Management is designed around actions an operator can actually take:
- Stage more vehicles in a zone.
- Recover unavailable vehicles.
- Rebalance vehicles from one zone to another.
- Avoid a zone that is already saturated.
- Add a small first-bet number of vehicles.
- Hold and collect more data.
- Tune pricing when pricing is the better lever than supply.
The model is only one layer. The operating loop matters more:
1. Observe rider intent and completed trips.
2. Compare demand to effective supply.
3. Recommend a reversible action.
4. Execute through the dashboard and field team.
5. Measure predicted versus actual results.
6. Feed outcomes back into the next forecast.
That is what turns analytics into operations.
How Operators Should Use It
Demand management is most useful when it becomes a cadence, not a one-time report.
Daily operations
Use the positioning plan to decide where to stage, recover, rebalance, or avoid. This is the morning and mid-day workflow for field teams.
Weekly growth review
Use the Growth Command Center to inspect opportunity zones, supply constraints, demand funnel conversion, and forecast accuracy. Decide whether the market needs more vehicles or better availability.
Expansion planning
Before buying hardware, model added vehicles, payback, contribution profit, and saturation. Use the first-bet recommendation as the default starting point.
City or property reporting
Use the analysis to explain how placement decisions are made. A hotel, campus, city, apartment community, or resort does not need every possible vehicle on-site. It needs the right amount of supply at the times and places guests, residents, students, or riders actually need it.
The Metrics That Matter
A demand-managed fleet should track more than total rides.
The key metrics are:
- Trips per vehicle per day - whether vehicles are earning enough to justify their footprint.
- Effective fleet size - how many vehicles are truly available after low battery, maintenance, offline status, and in-use vehicles.
- Unmet demand - how often riders wanted a vehicle but could not find one nearby.
- App-to-paid conversion - how well rider intent turns into revenue.
- No-supply and sold-out searches - where supply is missing or temporarily exhausted.
- Average nearest vehicle distance - whether supply is close enough to be useful.
- Contribution profit - whether extra trips justify vehicle cost, field labor, charging, maintenance, and depreciation.
- Forecast accuracy - whether the model's predictions match observed outcomes.
These metrics move the conversation from "how many scooters do we have?" to "how much useful, available mobility are we providing?"
Where This Matters Most
Demand management is valuable anywhere supply is expensive, streets are constrained, or demand changes by hour.
The strongest use cases include:
- Tourism districts where weekend and seasonal spikes can mislead simple averages.
- Hotels and resorts where guest demand clusters around check-in, dinner, events, beach access, or transit connections.
- Campuses where class schedules and event calendars create sharp directional demand.
- Apartment communities where commute windows matter more than all-day availability.
- Small cities where overdeployment can create political backlash faster than it creates revenue.
- Public shared fleets where permit renewals depend on a credible plan for clutter, equity, and service quality.
In each case, the operator needs a way to distinguish persistent demand from temporary noise, supply shortage from poor placement, and growth opportunity from operational drag.
Limits And Responsible Use
Demand management should improve decisions, not automate every decision.
Levy exposes confidence and source-quality signals because forecasts vary by market maturity and data volume. A dense market with consistent trip history and clear unmet-demand events can support stronger recommendations. A new market with limited data may need a smaller pilot and a longer observation window.
Modeled lift is not the same as measured lift. Forecasted trips, revenue, and contribution profit should be validated against actual outcomes after deployment. That is why the Growth Command Center includes forecast accuracy and outcome review, and why the first-bet workflow matters.
Privacy also matters. Rider intent data should be used to improve service, not to expose individual rider behavior. Levy's AI Ops workflows are built around subaccount-scoped analysis and operational aggregates, with sensitive search and location data handled as operational telemetry rather than a marketing export.
The Bigger Shift
Urban electric mobility is entering a more disciplined phase.
The winning operators will not be the ones with the biggest pile of vehicles. They will be the ones that know where demand is forming, how much supply is enough, when to rebalance, when to recover availability, and when to stop adding vehicles.
That is what Levy Demand Management is built to support.
It gives operators a way to grow fleets without guessing, serve riders without flooding streets, and explain deployment decisions with data. For cities, that means less clutter and more accountable mobility. For operators, it means better utilization, more disciplined capital spending, and a clearer path from rider intent to profitable trips.
See how Levy AI Ops and the Growth Command Center work together: start with AI Demand Prediction, review the Growth Command Center guide, or book a demo to model demand management for your fleet.